

Skill project3-7 daysStarter
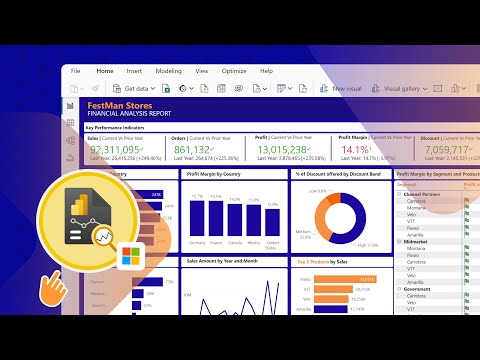
Monthly CFO Pack - Power BI or Excel Dashboard
A risk dashboard or validation memo with metrics, stress tests, breach logic, and management actions.
Steps
5
Outputs
7
Power BI (free Desktop version) or ExcelSimulate source data in Excel (realistic INR numbers)SQLExcel or Google Sheets
Open project workspaceOpen full project briefWhat to do
Scenario
You are working as a Equity Research. Your manager asks you to use Management Reporting to answer a real business or investment question and present a decision-ready output.
Objective
Show that you can apply Management Reporting in a practical analyst workflow, not only explain the theory.
How to start
- Define the portfolio, exposure, product, or process under review.
- Choose risk metrics such as VaR, drawdown, volatility, PD/LGD, limits, or loss frequency.
- Set data assumptions and limitations upfront.
Step-by-step execution
- Clean the dataset and define risk factors.
- Calculate baseline risk metrics and limit usage.
- Run stress scenarios and compare against risk appetite.
- Create a dashboard or memo explaining breaches and trends.
- Recommend actions such as hedge, reduce, monitor, escalate, or change controls.
What to submit
- Brief
- Model or notebook
- Charts or dashboard
- Resume bullet
- Source and assumption log
- One-page executive summary
- Final memo PDF
Data and sources
- NSE/BSE market data
- RBI/SEBI circulars where relevant
- Public historical price data
- Synthetic loss-event dataset
- Company risk disclosures
Quality checklist
- Risk metric selection matches the exposure.
- Stress scenarios are explained.
- Dashboard separates signal from noise.
- Limit breach logic is auditable.
- Recommendations are practical and prioritized.
Interview talk track
- Problem: explain the business question and why it matters for Equity Research.
- Method: describe the data collected, assumptions made, and analysis performed.
- Decision: state the recommendation, key risk, and what would change your view.
Resume bullet
Built a a risk dashboard or validation memo with metrics, stress tests, breach logic, and management actions. for Management Reporting, using Power BI (free Desktop version) or Excel, Simulate source data in Excel (realistic INR numbers) to convert raw information into a decision-ready finance output.